

Validation - Urban Blast
Introduction
This document presents validation of urban blast simulations using the software.
Version control
The tests presented in this document are subjected to version control, meaning that the models are run and evaluated prior to release of a new solver. This document is updated in conjunction with official releases of the software.
Verification - Hemispherical Blast
Hemispherical blast using quarter symmetry
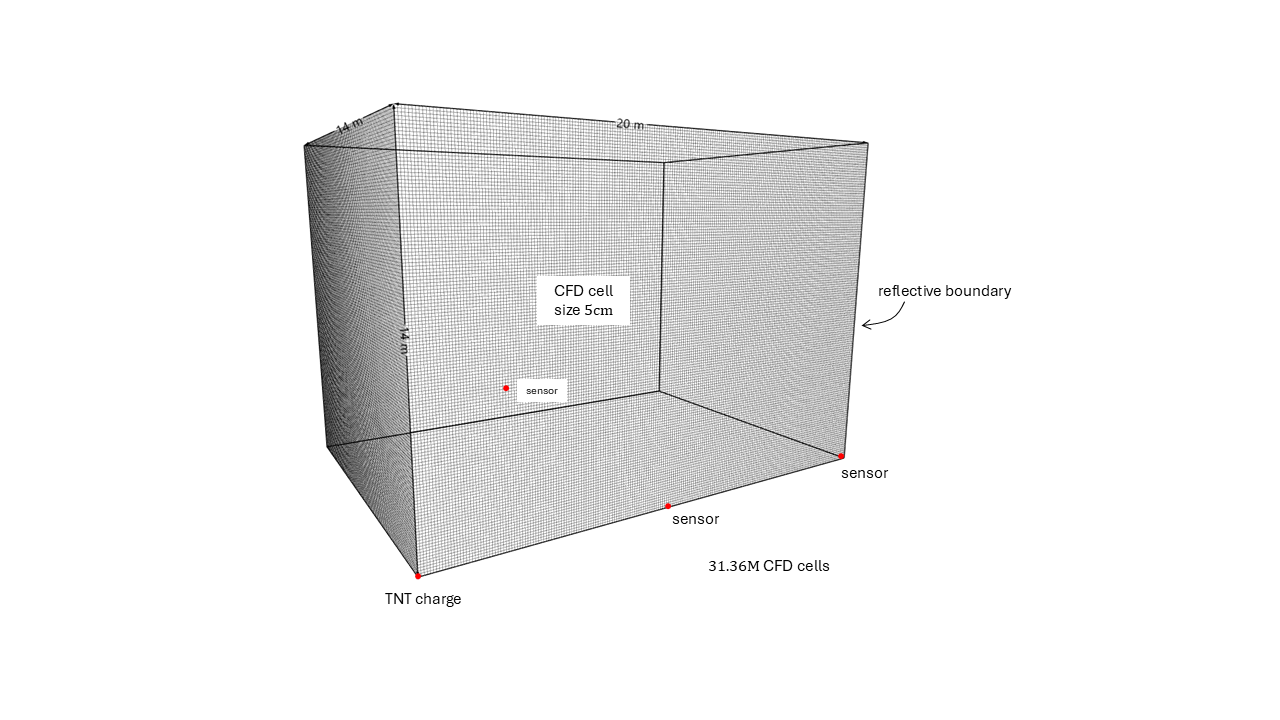
This benchmark is done to validate the CFD solver using a hemispherical blast simulation. The test is done with two different setups, both using identical CFD domains. The CFD domain for both tests is created with quarter symmetry and dimensions of 20 × 14 × 14 m in the x-, y-, and z-directions, with a cell size of 0.05 m.
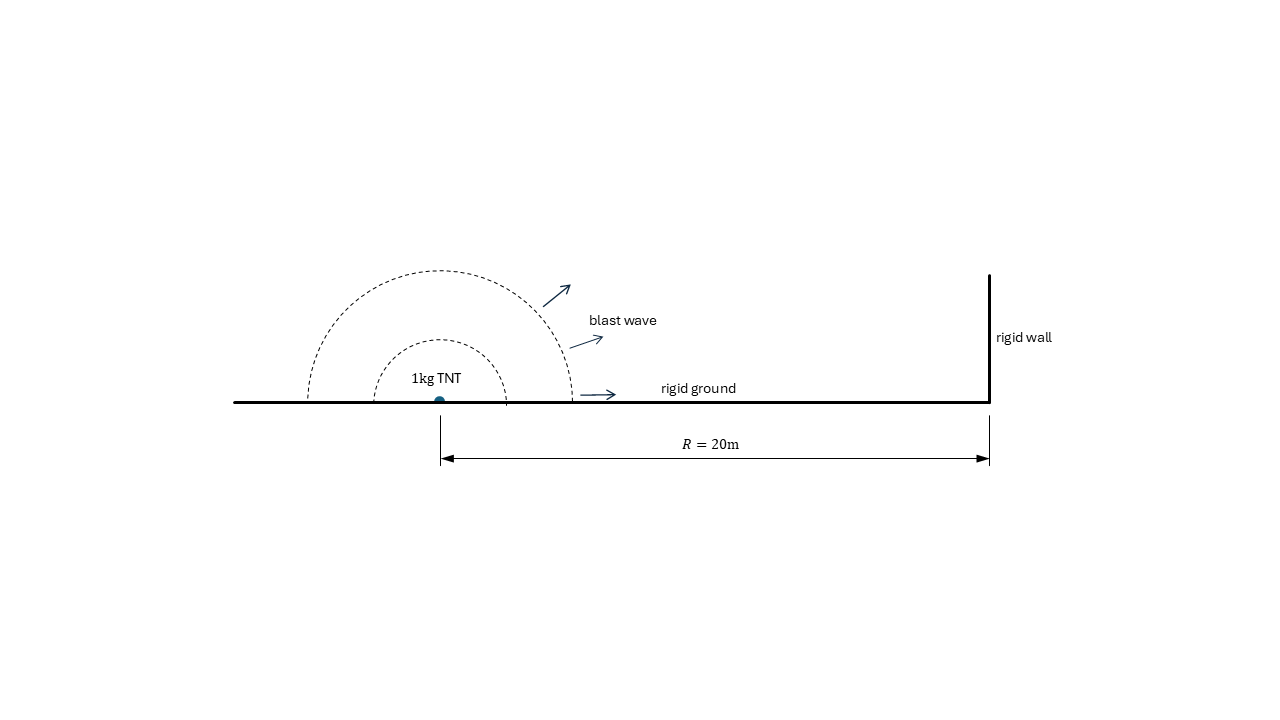
A hemispherical explosive charge of 1 kg TNT is positioned on a rigid ground plane. After detonation, the blast wave is measured by three sensors placed in the domain. The simulated responses in the sensors are then compared to the Kingery-Bulmash equations. Two sensors are placed 10 meters from the detonation, one located along the boundary and the other positioned diagonally from the detonation point. The third sensor is also placed along the boundary, but 20 meters from the detonation point. At the sensors located 10 meters from the detonation point, incident pressure and impulse are measured, while the sensor at 20 meters is compared to the reflected quantities from Kingery-Bulmash.
*CFD_BLAST_1D mapping
The second simulation is done in two steps. The first step is done by the *CFD_BLAST_1D command. The simulation runs up until just before the blast wave reaches the first sensor with the 1D solver. From that point, a mapping to the 3D CFD domain is done for the remaining part of the simulation.
Results
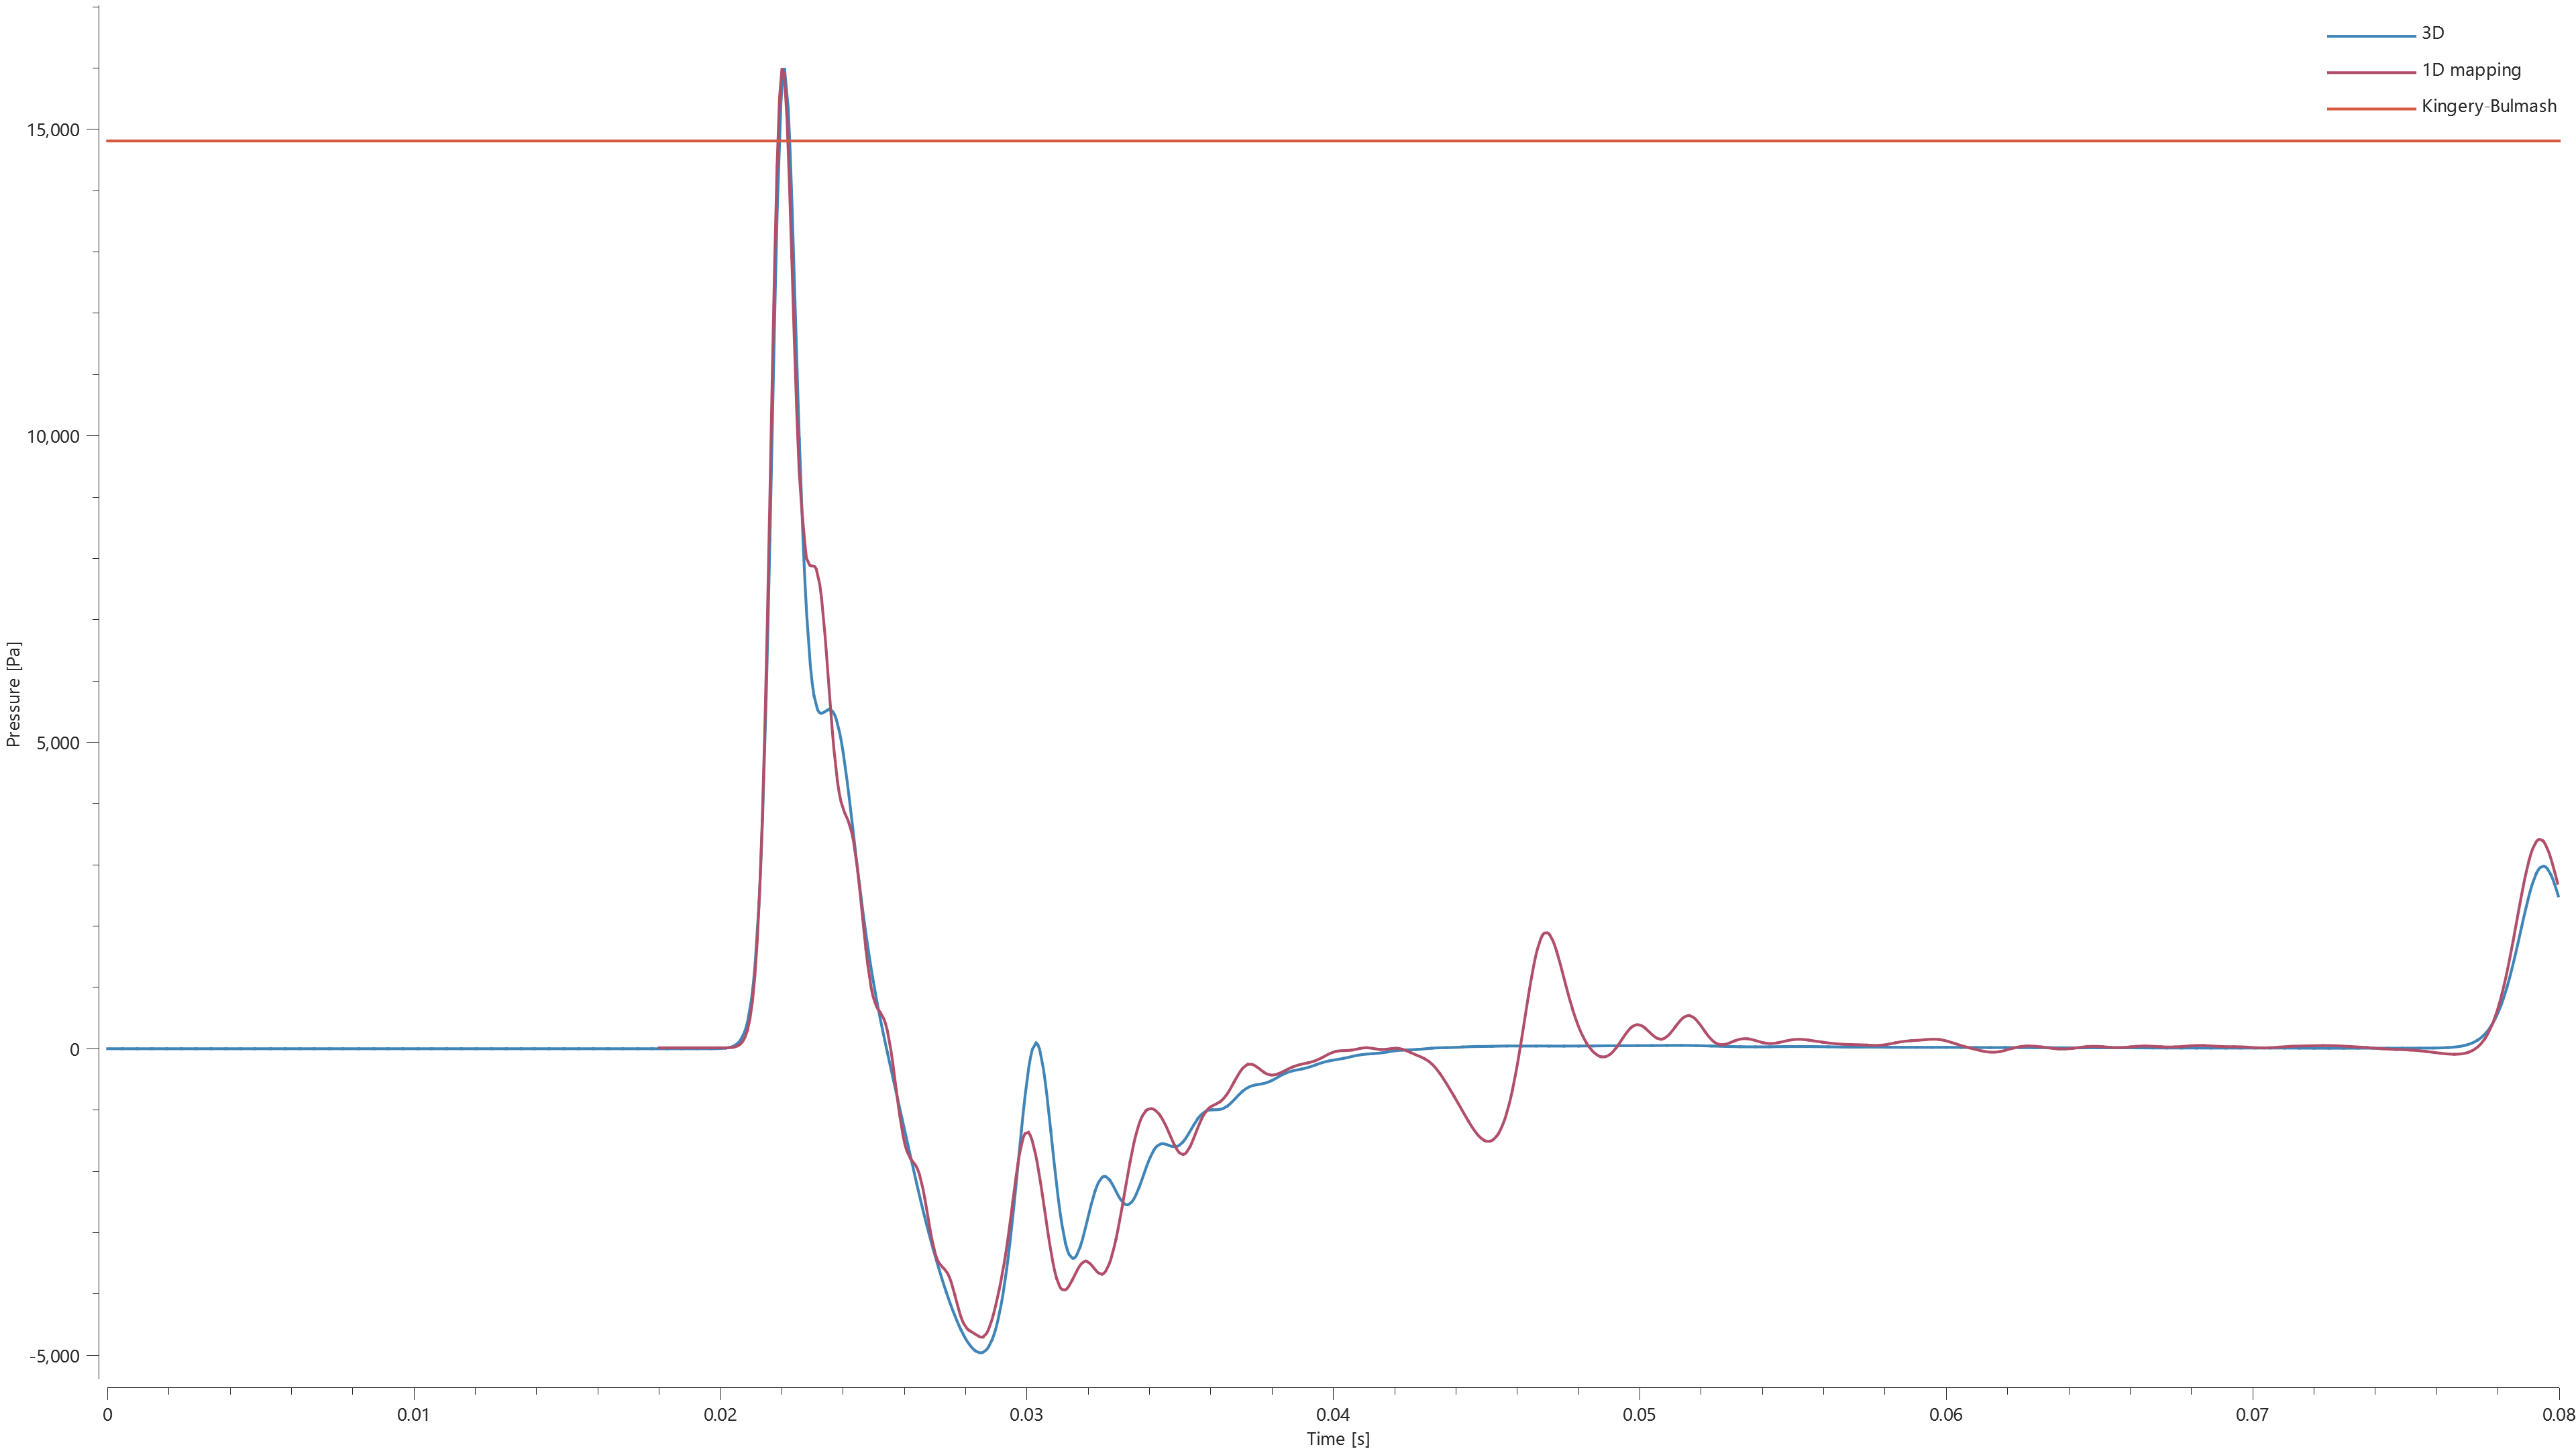
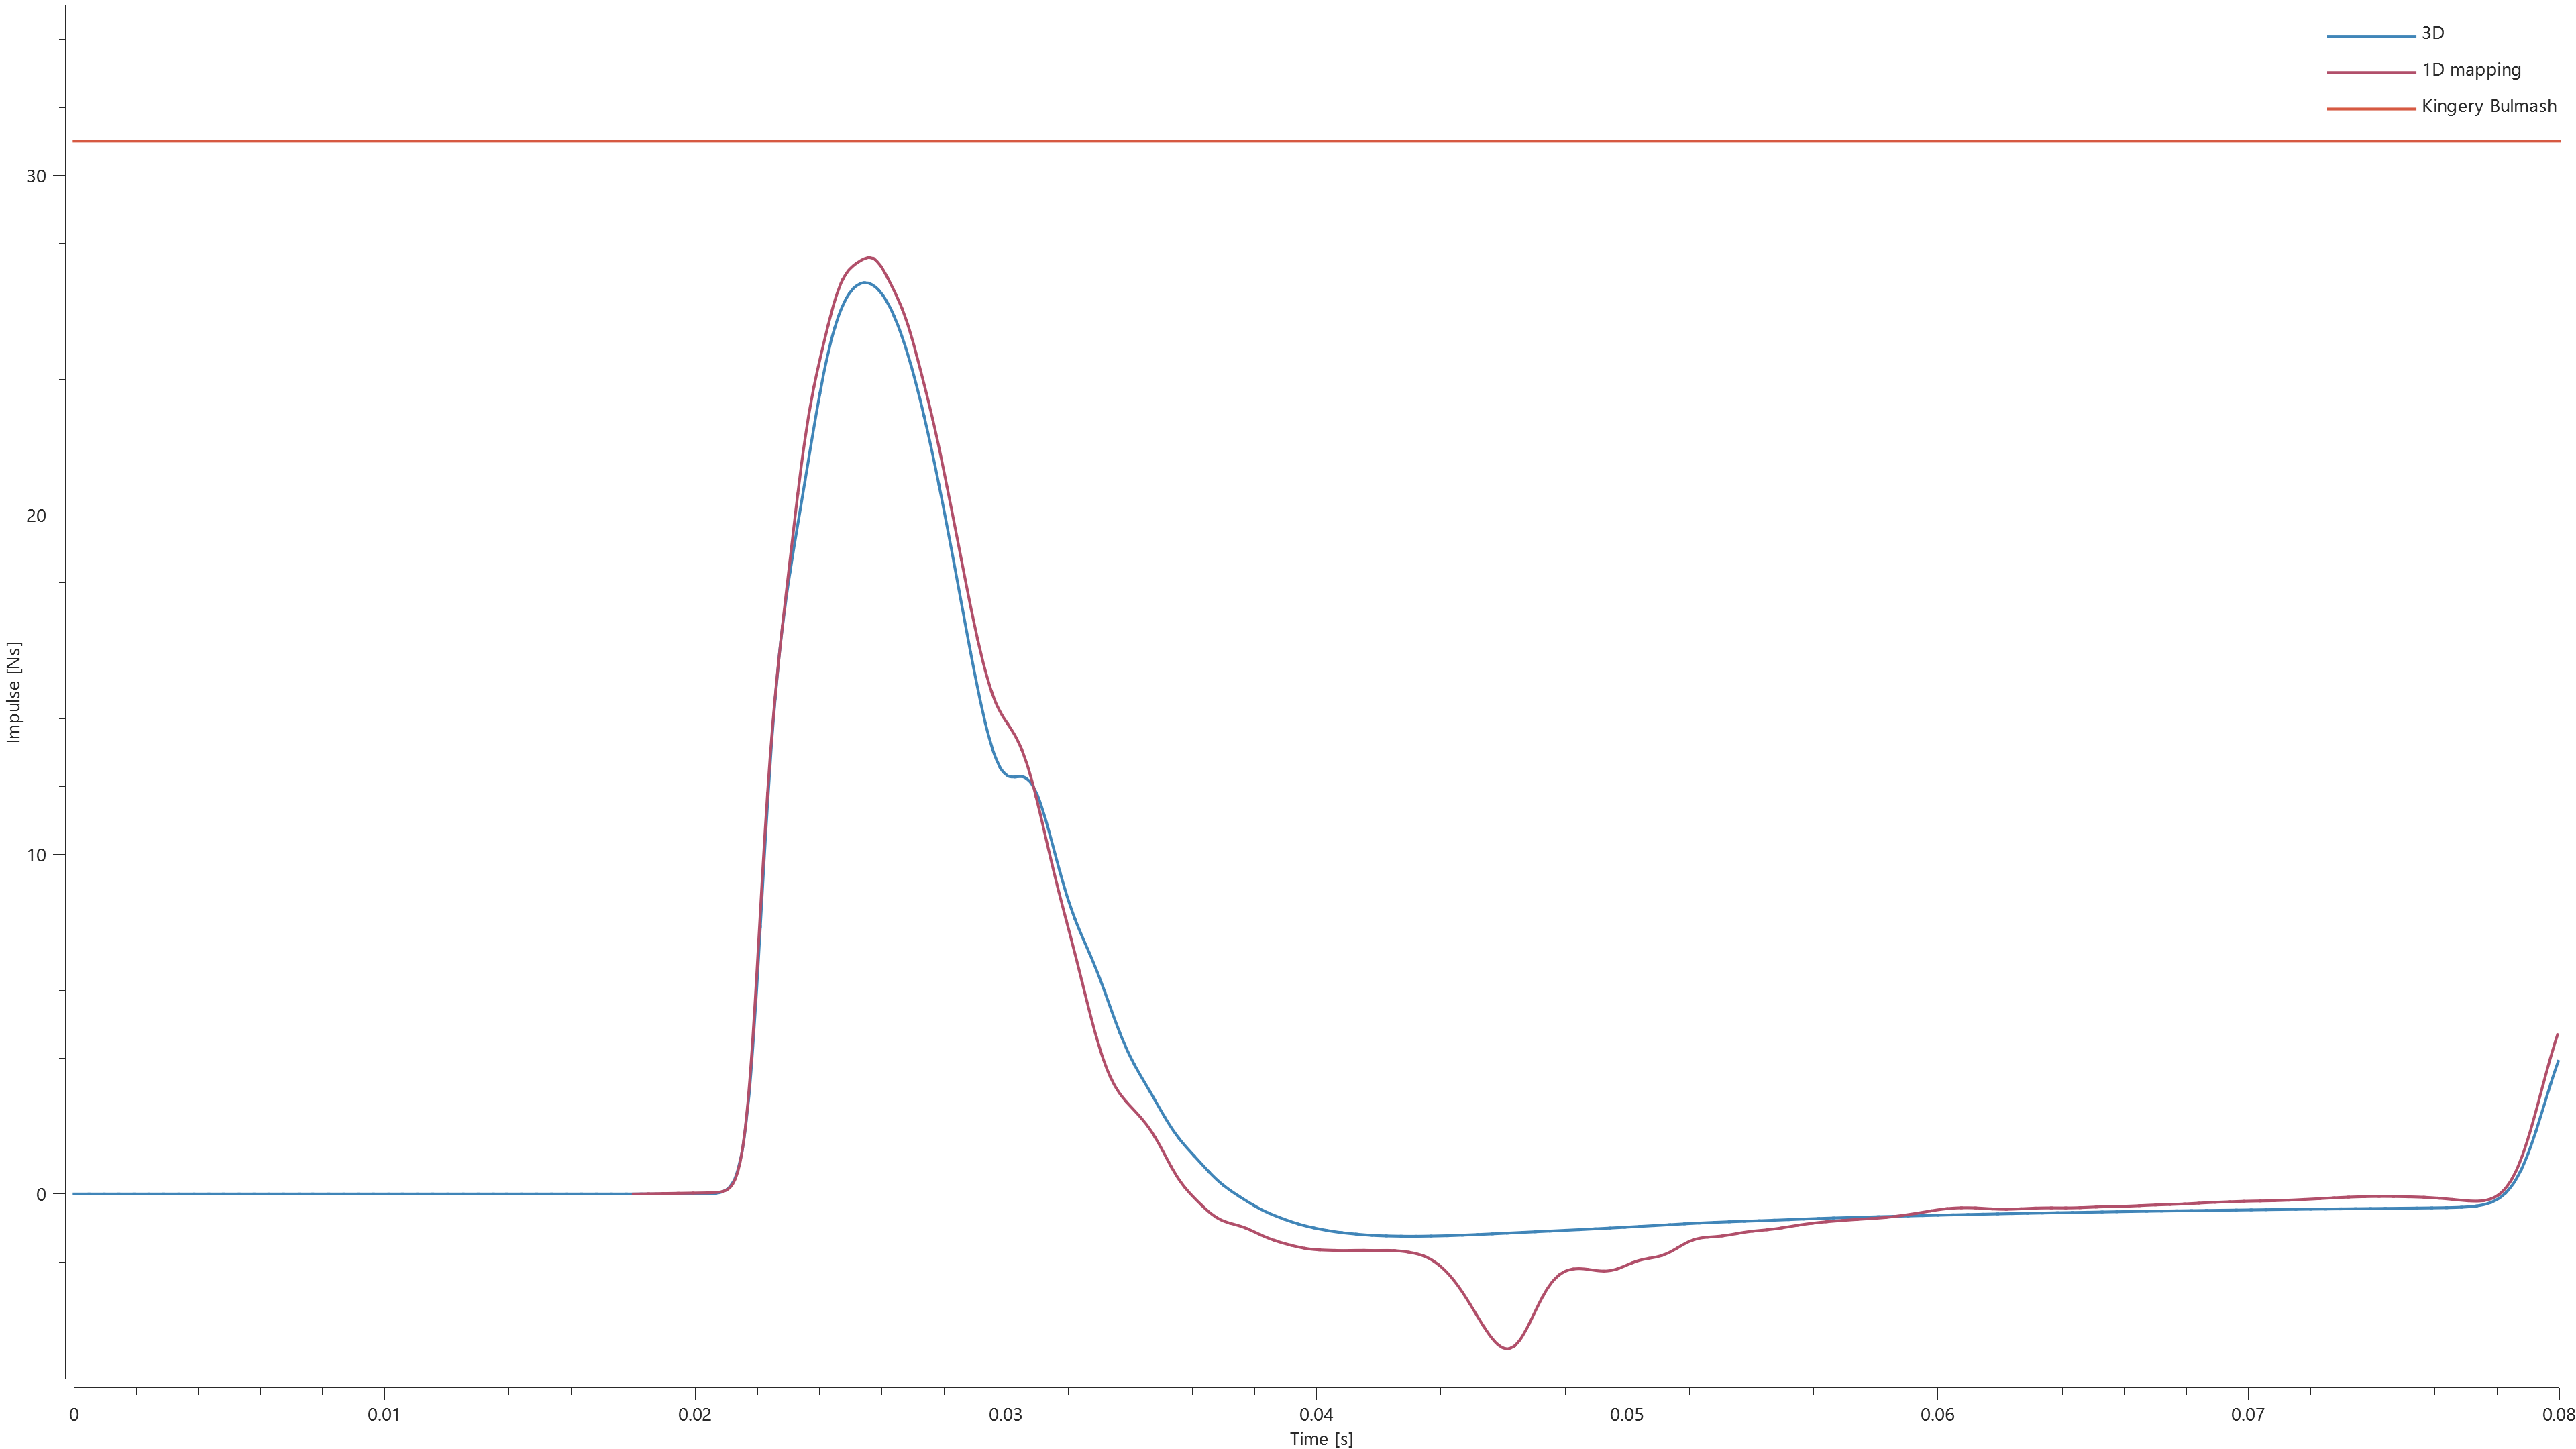
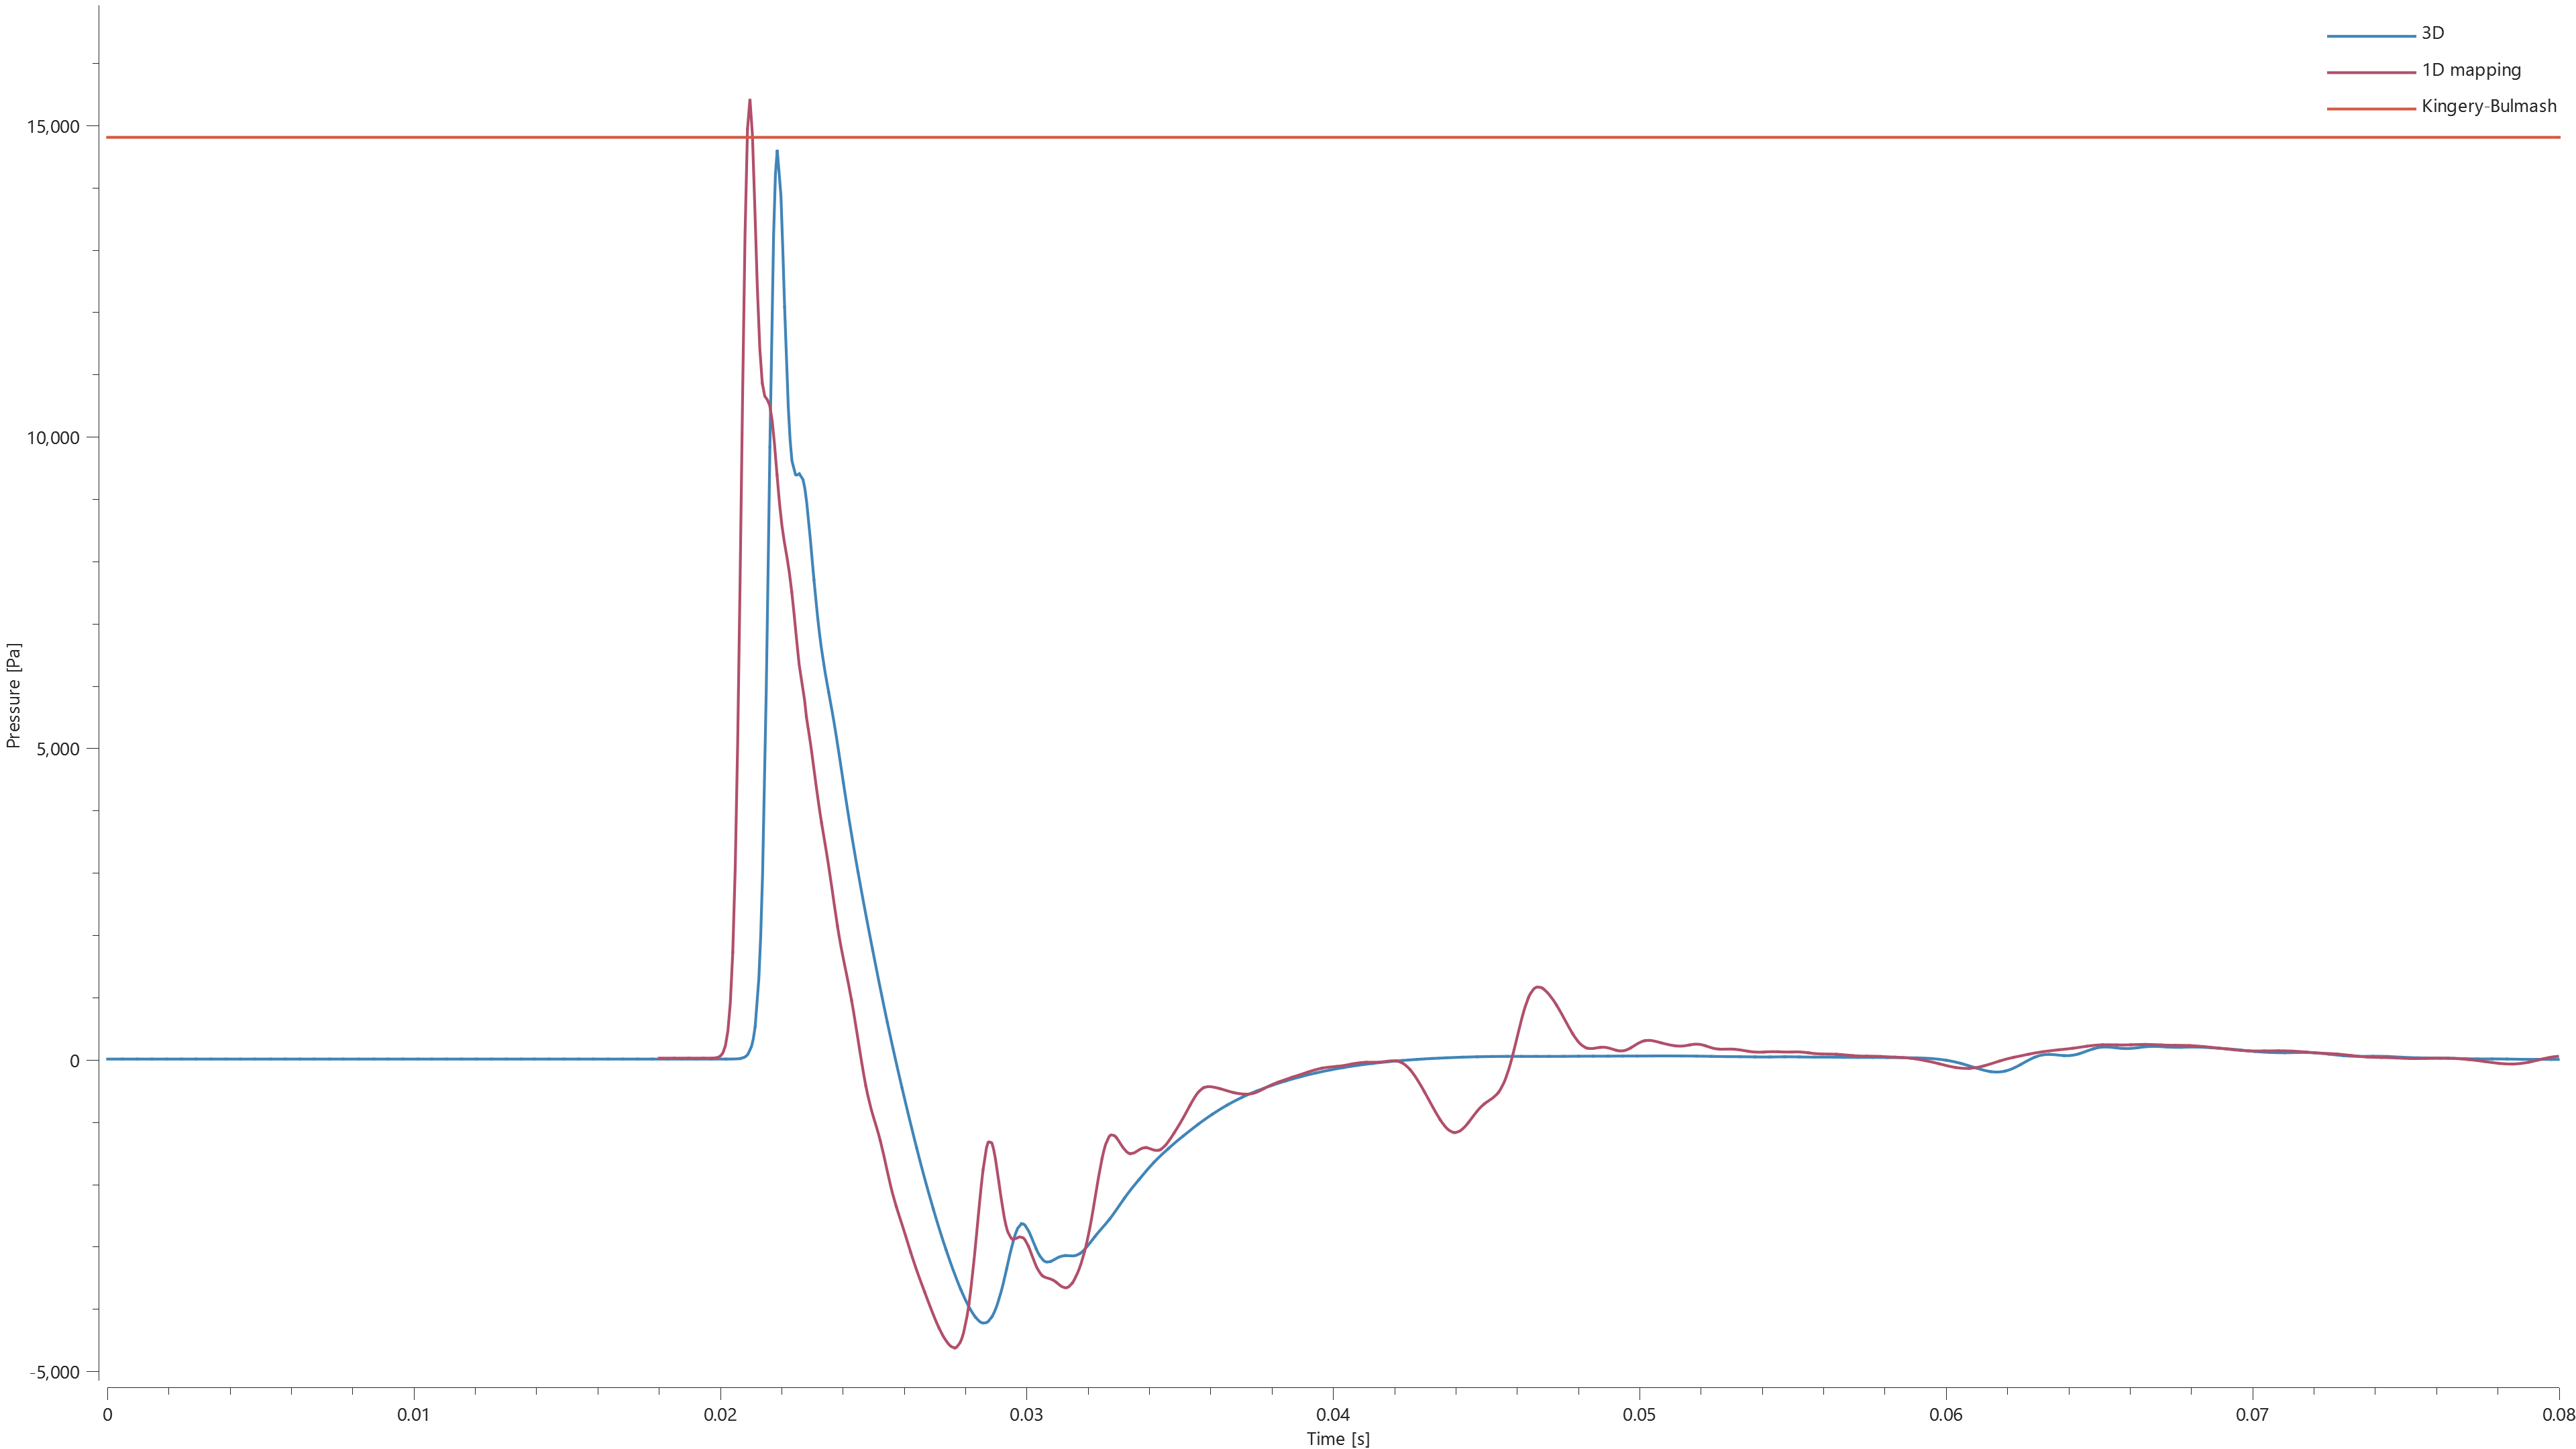
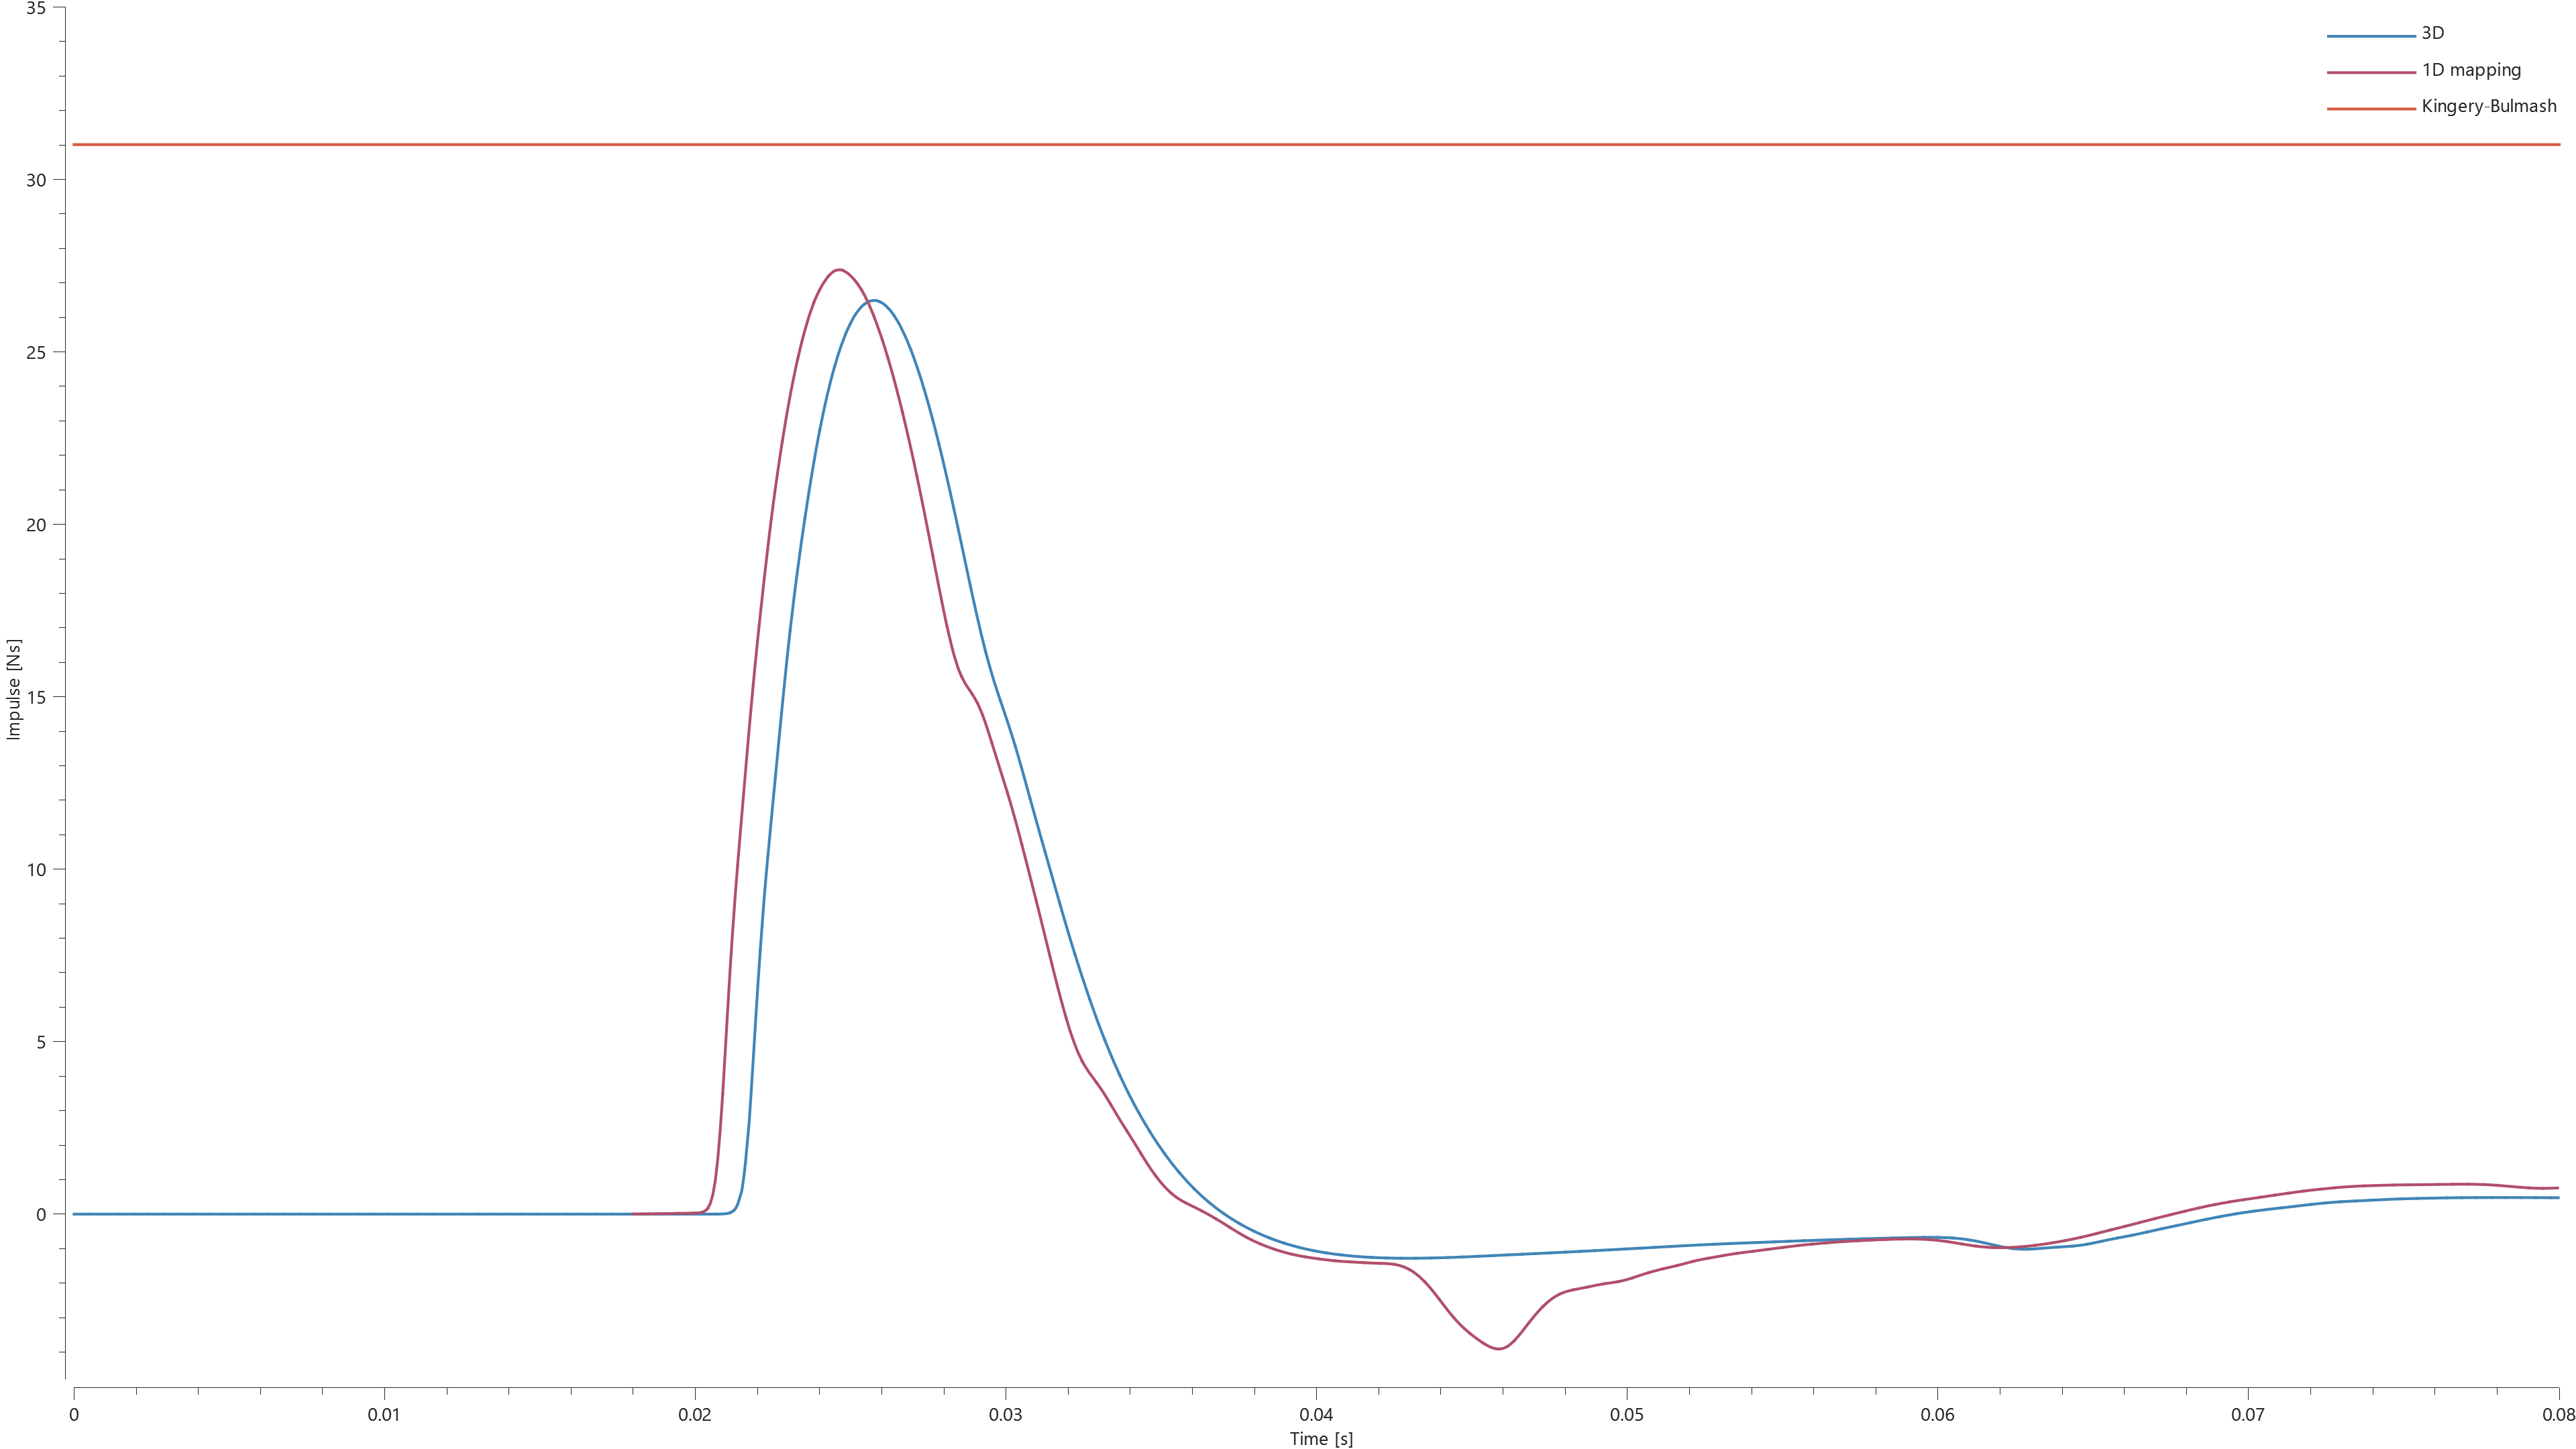
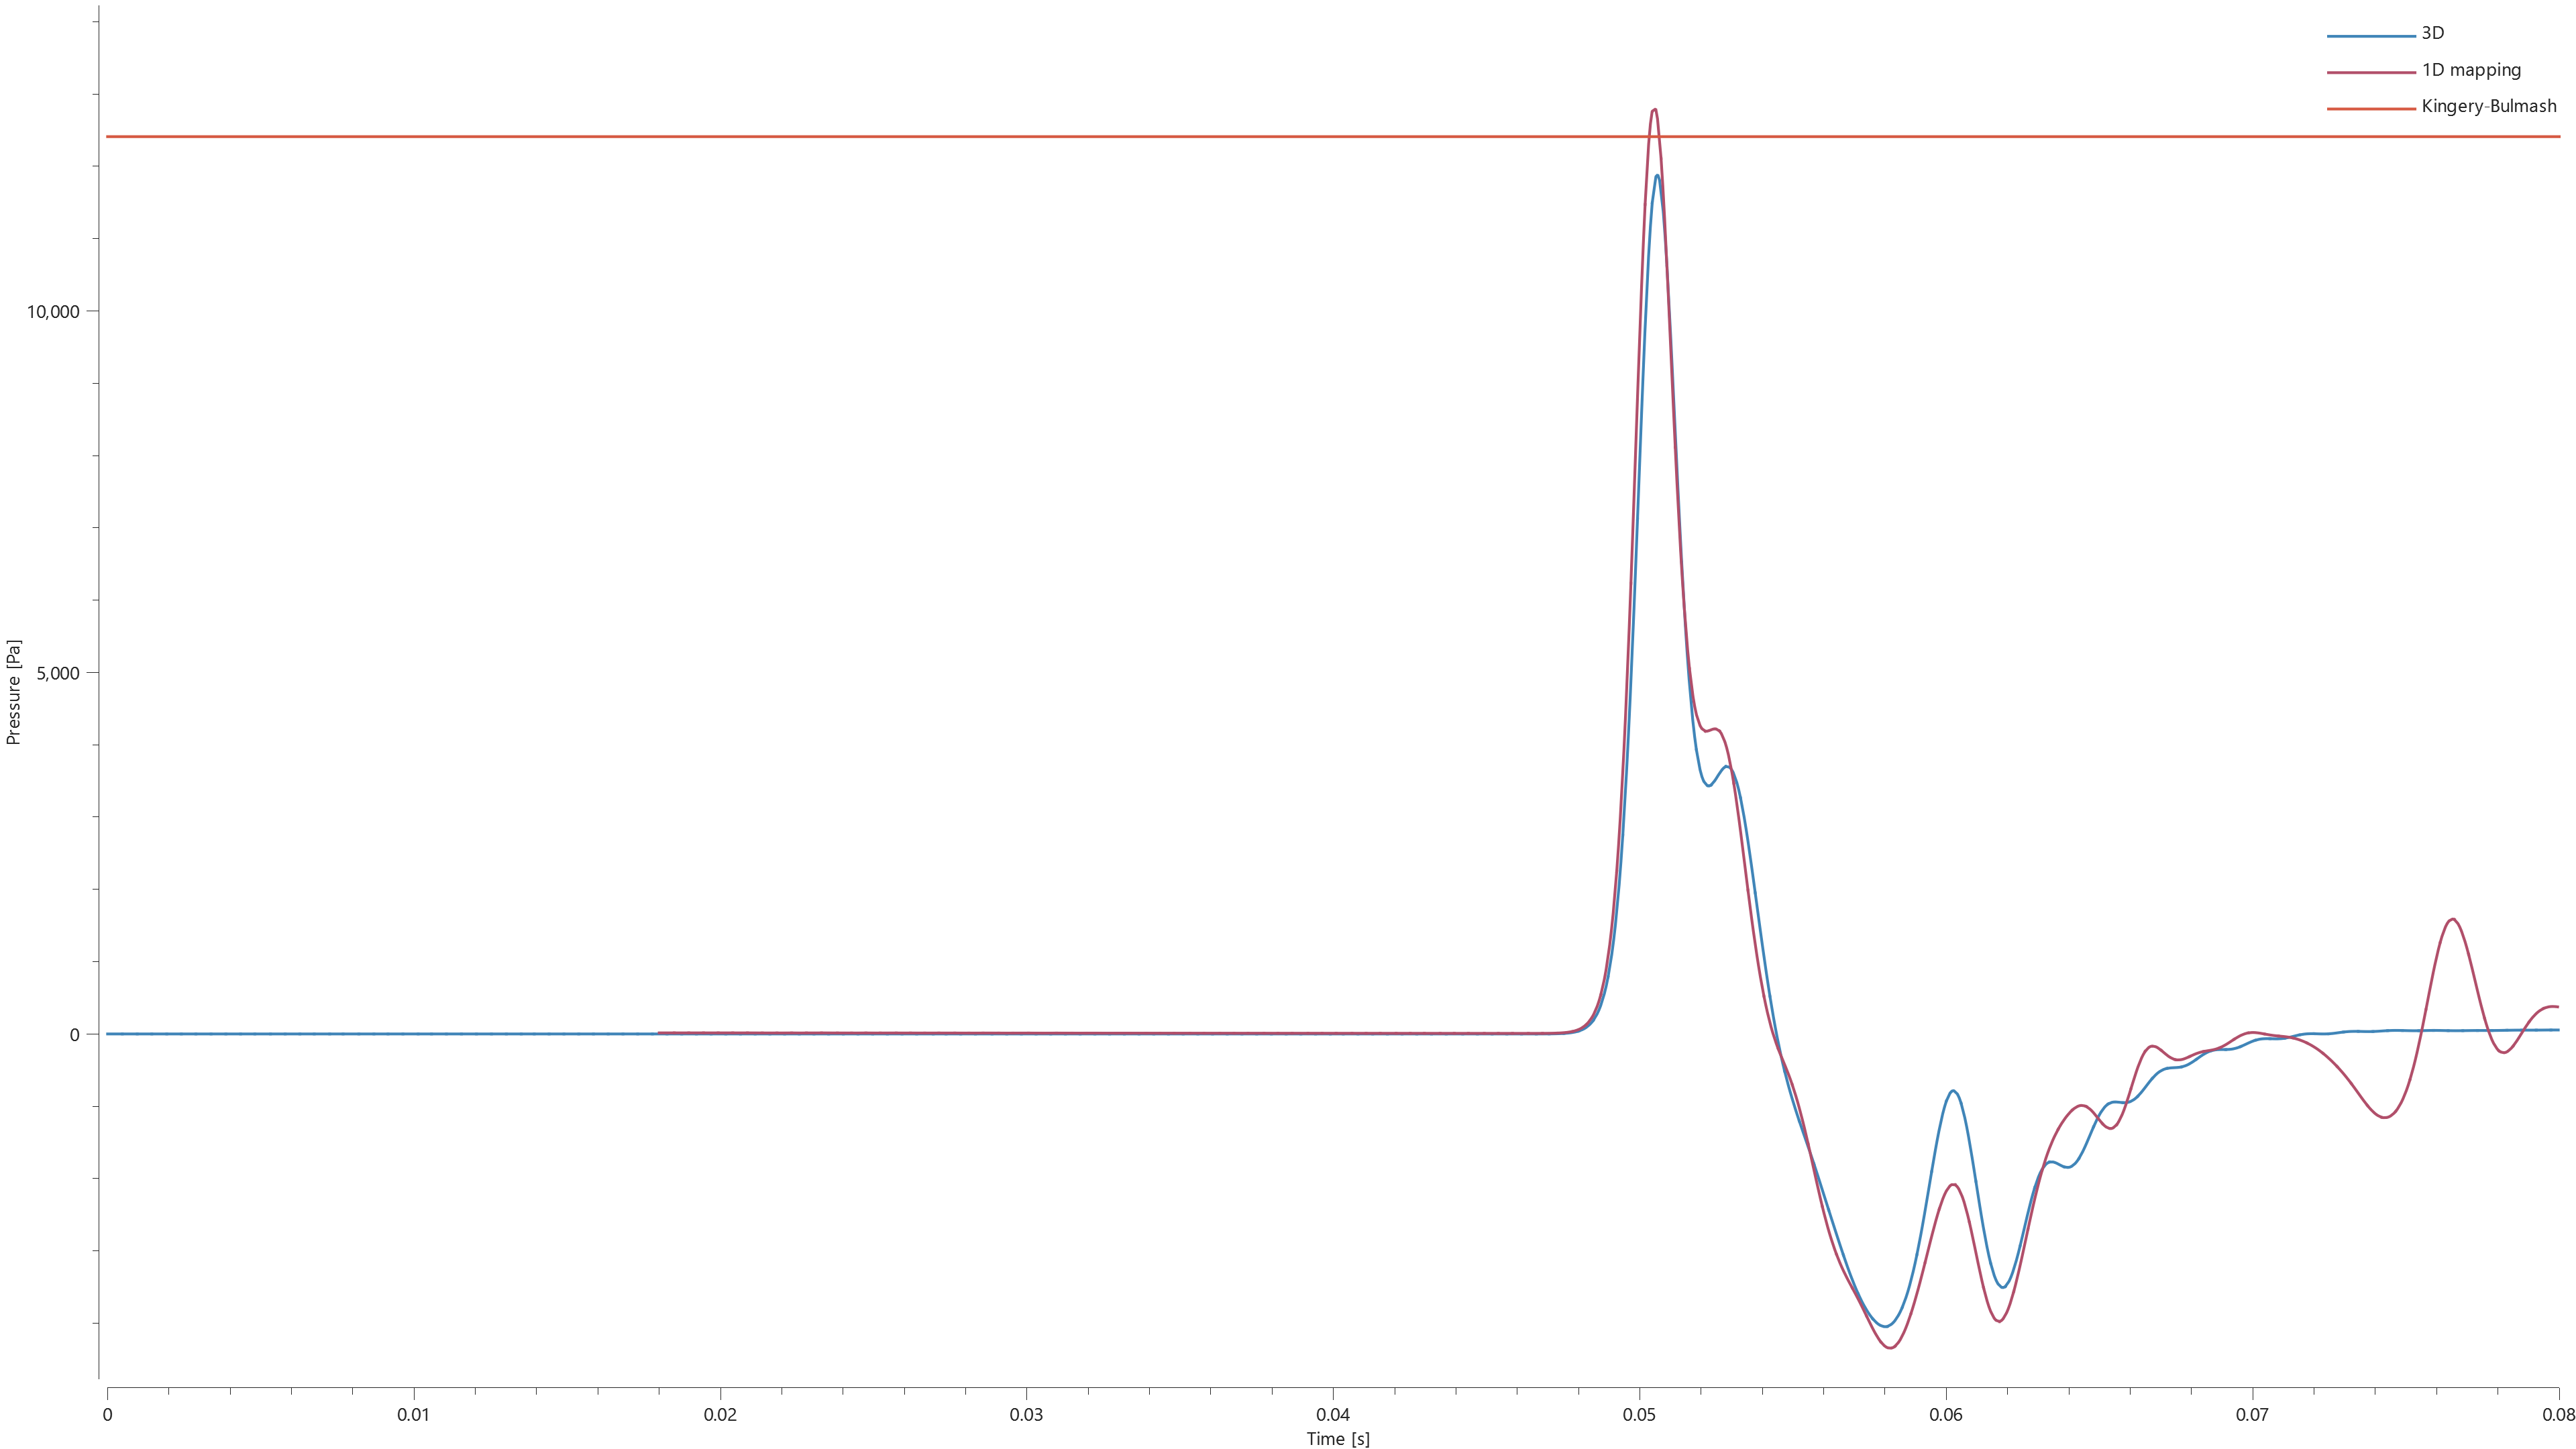
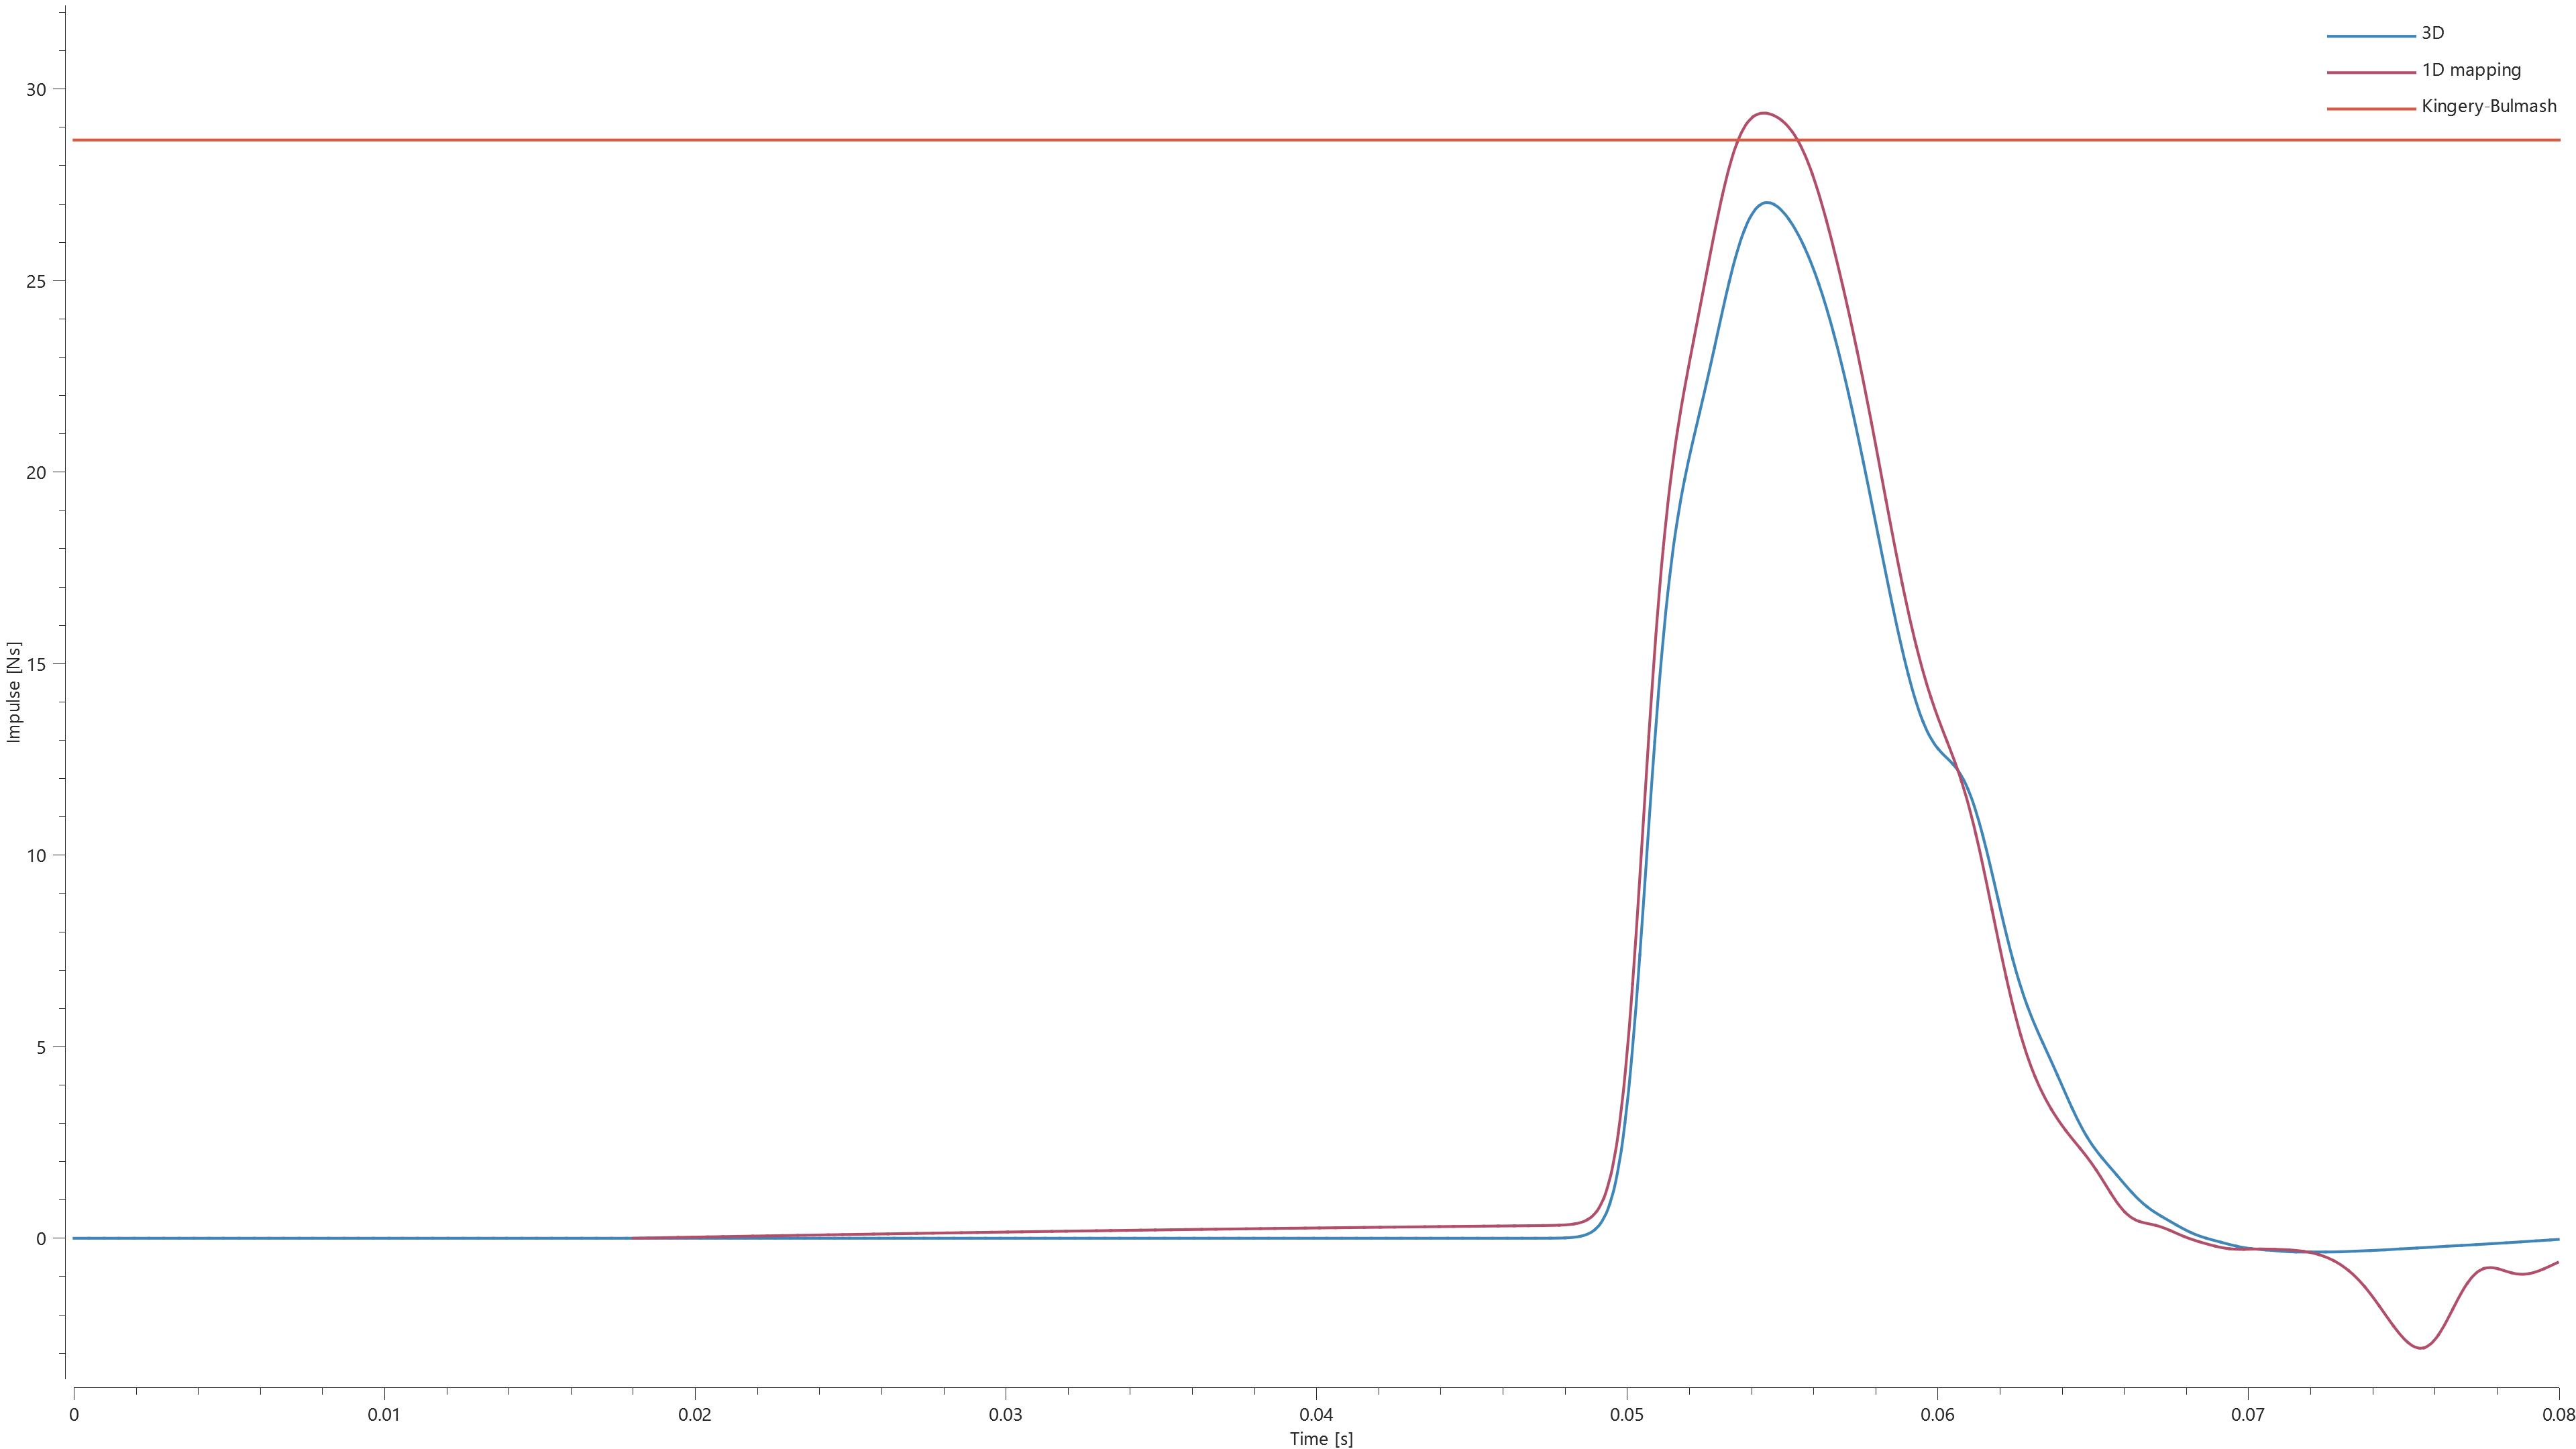
Pressure and impulse are checked at the sensors. Energy levels within the models are also checked for version control.
Tests
This benchmark is associated with 3 tests.